Page 168 - MSM_AR2020
P. 168

CHAIRMAN’S           DELIVERING            MSM           MANAGEMENT DISCUSSION    GROUP FINANCIAL
                  STATEMENT             VALUE               OVERVIEW            & ANALYSIS            REPORT


           NOTES TO THE FINANCIAL STATEMENTS
           FOR THE FINANCIAL YEAR ENDED 31 DECEMBER 2020


           4   FINANCIAL RISK MANAGEMENT (CONTINUED)

               (a)  Financial risk management policies (continued)
                   Market risk (continued)
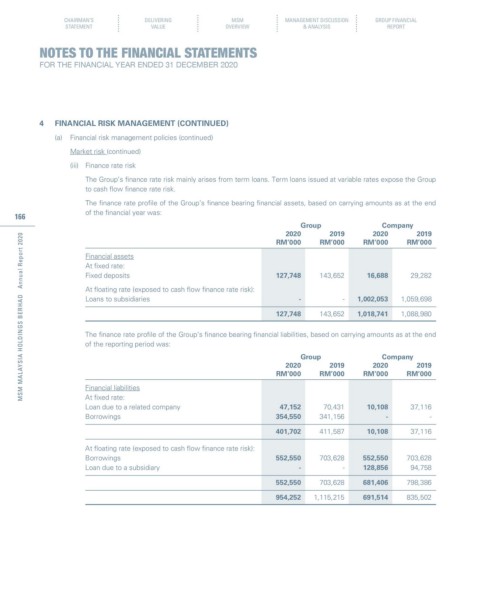
                   (iii)  Finance rate risk
                       The Group’s finance rate risk mainly arises from term loans. Term loans issued at variable rates expose the Group
                       to cash flow finance rate risk.
                       The finance rate profile of the Group’s finance bearing financial assets, based on carrying amounts as at the end
                       of the financial year was:
     166
                                                                               Group                Company
                                                                           2020        2019       2020       2019
       MSM MALAYSIA HOLDINGS BERHAD   Annual Report 2020
                                                                         RM’000     RM’000     RM’000      RM’000
                       Financial assets
                       At fixed rate:
                       Fixed deposits                                    127,748    143,652     16,688      29,282
                       At floating rate (exposed to cash flow finance rate risk):
                       Loans to subsidiaries                                   -          -   1,002,053  1,059,698
                                                                         127,748    143,652   1,018,741  1,088,980


                       The finance rate profile of the Group’s finance bearing financial liabilities, based on carrying amounts as at the end
                       of the reporting period was:
                                                                               Group                Company
                                                                           2020        2019       2020       2019
                                                                         RM’000     RM’000     RM’000      RM’000
                       Financial liabilities
                       At fixed rate:
                       Loan due to a related company                      47,152     70,431     10,108      37,116
                       Borrowings                                        354,550    341,156          -           -
                                                                         401,702    411,587     10,108      37,116

                       At floating rate (exposed to cash flow finance rate risk):
                       Borrowings                                        552,550    703,628    552,550     703,628
                       Loan due to a subsidiary                                -          -    128,856      94,758

                                                                         552,550    703,628    681,406     798,386
                                                                         954,252   1,115,215   691,514     835,502
   163   164   165   166   167   168   169   170   171   172   173