
Page 228 - MSM_AR2020
P. 228
CHAIRMAN’S DELIVERING MSM MANAGEMENT DISCUSSION GROUP FINANCIAL
STATEMENT VALUE OVERVIEW & ANALYSIS REPORT
NOTES TO THE FINANCIAL STATEMENTS
FOR THE FINANCIAL YEAR ENDED 31 DECEMBER 2020
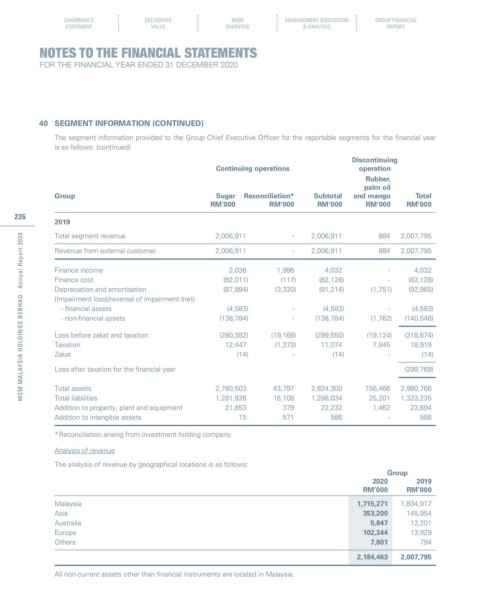
40 SEGMENT INFORMATION (CONTINUED)
The segment information provided to the Group Chief Executive Officer for the reportable segments for the financial year
is as follows: (continued)
Discontinuing
Continuing operations operation
Rubber,
palm oil
Group Sugar Reconciliation* Subtotal and mango Total
RM’000 RM’000 RM’000 RM’000 RM’000
226
2019
Total segment revenue 2,006,911 - 2,006,911 884 2,007,795
MSM MALAYSIA HOLDINGS BERHAD Annual Report 2020
Revenue from external customer 2,006,911 - 2,006,911 884 2,007,795
Finance income 2,036 1,996 4,032 - 4,032
Finance cost (82,011) (117) (82,128) - (82,128)
Depreciation and amortisation (87,894) (3,320) (91,214) (1,751) (92,965)
(Impairment loss)/reversal of impairment (net)
- financial assets (4,583) - (4,583) - (4,583)
- non-financial assets (138,784) - (138,784) (1,762) (140,546)
Loss before zakat and taxation (280,382) (19,168) (299,550) (19,124) (318,674)
Taxation 12,447 (1,373) 11,074 7,845 18,919
Zakat (14) - (14) - (14)
Loss after taxation for the financial year (299,769)
Total assets 2,780,503 43,797 2,824,300 156,466 2,980,766
Total liabilities 1,281,926 16,108 1,298,034 25,201 1,323,235
Addition to property, plant and equipment 21,853 379 22,232 1,462 23,694
Addition to intangible assets 15 571 586 - 586
*Reconciliation arising from investment holding company.
Analysis of revenue
The analysis of revenue by geographical locations is as follows:
Group
2020 2019
RM’000 RM’000
Malaysia 1,715,271 1,834,917
Asia 353,200 145,954
Australia 5,847 12,201
Europe 102,344 13,929
Others 7,801 794
2,184,463 2,007,795
All non-current assets other than financial instruments are located in Malaysia.