
Page 47 - MSM_AR2020
P. 47
SUSTAINABILITY EFFECTIVE CORPORATE FINANCIAL ADDITIONAL DETAILS OF THE ANNUAL
REPORT LEADERSHIP GOVERNANCE STATEMENTS INFORMATION GENERAL MEETING
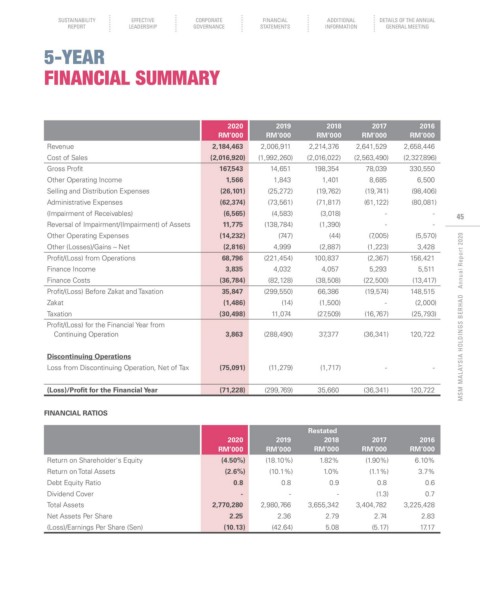
5-yEAR
FINANCIAL SuMMARy
2020 2019 2018 2017 2016
RM’000 RM’000 RM’000 RM’000 RM’000
Revenue 2,184,463 2,006,911 2,214,376 2,641,529 2,658,446
Cost of Sales (2,016,920) (1,992,260) (2,016,022) (2,563,490) (2,327,896)
Gross Profit 167,543 14,651 198,354 78,039 330,550
Other Operating Income 1,566 1,843 1,401 8,685 6,500
Selling and Distribution Expenses (26,101) (25,272) (19,762) (19,741) (98,406)
Administrative Expenses (62,374) (73,561) (71,817) (61,122) (80,081)
(Impairment of Receivables) (6,565) (4,583) (3,018) - - 45
Reversal of Impairment/(Impairment) of Assets 11,775 (138,784) (1,390) - -
Other Operating Expenses (14,232) (747) (44) (7,005) (5,570)
Other (Losses)/Gains – Net (2,816) 4,999 (2,887) (1,223) 3,428
Profit/(Loss) from Operations 68,796 (221,454) 100,837 (2,367) 156,421
Finance Income 3,835 4,032 4,057 5,293 5,511
Finance Costs (36,784) (82,128) (38,508) (22,500) (13,417)
Profit/(Loss) Before Zakat and Taxation 35,847 (299,550) 66,386 (19,574) 148,515
Zakat (1,486) (14) (1,500) - (2,000)
Taxation (30,498) 11,074 (27,509) (16,767) (25,793) MSM MALAYSIA HOLDINGS BERHAD Annual Report 2020
Profit/(Loss) for the Financial Year from
Continuing Operation 3,863 (288,490) 37,377 (36,341) 120,722
Discontinuing Operations
Loss from Discontinuing Operation, Net of Tax (75,091) (11,279) (1,717) - -
(Loss)/Profit for the Financial Year (71,228) (299,769) 35,660 (36,341) 120,722
FINANCIAL RATIOS
Restated
2020 2019 2018 2017 2016
RM’000 RM’000 RM’000 RM’000 RM’000
Return on Shareholder's Equity (4.50%) (18.10%) 1.82% (1.90%) 6.10%
Return on Total Assets (2.6%) (10.1%) 1.0% (1.1%) 3.7%
Debt Equity Ratio 0.8 0.8 0.9 0.8 0.6
Dividend Cover - - - (1.3) 0.7
Total Assets 2,770,280 2,980,766 3,655,342 3,404,782 3,225,428
Net Assets Per Share 2.25 2.36 2.79 2.74 2.83
(Loss)/Earnings Per Share (Sen) (10.13) (42.64) 5.08 (5.17) 17.17