Page 49 - MSM_AR2020
P. 49

SUSTAINABILITY     EFFECTIVE        CORPORATE        FINANCIAL        ADDITIONAL    DETAILS OF THE ANNUAL
                   REPORT         LEADERSHIP       GOVERNANCE        STATEMENTS       INFORMATION    GENERAL MEETING
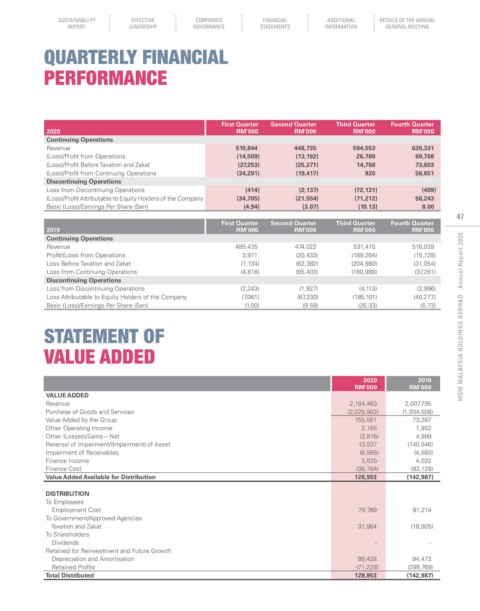

            QuARTERLy FINANCIAL

            PERFORMANCE


                                                           First quarter  Second quarter  Third quarter  Fourth quarter
             2020                                             RM’000         RM’000          RM’000         RM’000
             Continuing Operations
             Revenue                                           510,844        448,735        594,553         630,331
             (Loss)/Profit from Operations                     (14,509)       (13,192)        26,789         69,708
             (Loss)/Profit Before Taxation and Zakat           (27,253)       (25,271)        14,768          73,603
             (Loss)/Profit from Continuing Operations          (34,291)       (19,417)          920           56,651
             Discontinuing Operations
             Loss from Discontinuing Operations                  (414)         (2,137)        (72,131)         (409)
             (Loss)/Profit Attributable to Equity Holders of the Company   (34,705)   (21,554)   (71,212)    56,243
             Basic (Loss)/Earnings Per Share (Sen)               (4.94)         (3.07)         (10.13)         8.00
                                                                                                                        47
                                                           First quarter  Second quarter  Third quarter  Fourth quarter
             2019                                             RM’000         RM’000          RM’000         RM’000
             Continuing Operations
             Revenue                                           485,435        474,022        531,415         516,039
             Profit/(Loss) from Operations                       3,971        (20,433)       (189,264)       (15,728)
             Loss Before Taxation and Zakat                     (1,134)       (62,382)       (204,980)       (31,054)
             Loss from Continuing Operations                    (4,818)       (65,403)       (180,988)       (37,281)
             Discontinuing Operations
             Loss from Discontinuing Operations                 (2,243)        (1,927)         (4,113)        (2,996)
             Loss Attributable to Equity Holders of the Company   (7,061)      (67,330)      (185,101)       (40,277)
             Basic (Loss)/Earnings Per Share (Sen)               (1.00)         (9.58)         (26.33)         (5.73)    MSM MALAYSIA HOLDINGS BERHAD   Annual Report 2020


            STATEMENT OF


            VALuE ADDED


                                                                                               2020           2019
                                                                                              RM’000        RM’000
             VALUE ADDED
             Revenue                                                                        2,184,463      2,007,795
             Purchase of Goods and Services                                                (2,028,902)    (1,934,508)
             Value Added by the Group                                                        155,561         73,287
             Other Operating Income                                                             2,185         1,952
             Other (Losses)/Gains – Net                                                        (2,816)        4,999
             Reversal of Impairment/(Impairment) of Asset                                     13,537        (140,546)
             Impairment of Receivables                                                         (6,565)       (4,583)
             Finance Income                                                                     3,835         4,032
             Finance Cost                                                                     (36,784)      (82,128)
             Value Added Available for Distribution                                          128,953       (142,987)

             DISTRIBUTION
             To Employees
               Employment Cost                                                                79,769         81,214
             To Government/Approved Agencies
               Taxation and Zakat                                                              31,984       (18,905)
             To Shareholders
               Dividends                                                                           -             -
             Retained for Reinvestment and Future Growth
               Depreciation and Amortisation                                                  88,428         94,473
               Retained Profits                                                               (71,228)      (299,769)
             Total Distributed                                                               128,953       (142,987)
   44   45   46   47   48   49   50   51   52   53   54